Hi everyone,
Here are the sold numbers for the Cornell Community, August 2023. As always no %’s or averages, just pure numbers without the marketing gimmick or spin.
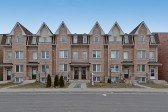
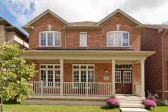
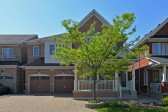
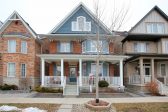
TOWNHOMES
| AREA | Bed | Bath | Storeys | Sq Feet | Basement | Garage | Days on Market | Sold Price | Notes |
| Upper Cornell | 2 | 3.5 | 3 | N/A | Finished | 1 | 8 | 1,020,000 | |
| Upper Cornell | 3 | 2.5 | 2 | 1500-2000 | Finished | 2 | 7 | 1,118,000 | Fronts on 16th, End Unit |
| Cornell Village | 3 | 3.5 | 2 | 1100-1500 | Finished | 1 | 8 | 900,000 | |
| Cornell Village | 3+1 | 2.5 | 2 | N/A | Finished | 1 | 3 | 988,000 | Fronts on 16th |
| Cornell Village | 3 | 2.5 | 2 | N/A | Unfinished | 1 | 27 | 1,050,800 | |
| Cornell Village | 3 | 3.5 | 2 | 1100-1500 | Finished | 1 | 2 | 1,100,000 | End Unit |
| Cornell Village | 3 | 2.5 | 2 | N/A | Finished | 1 | 24 | 1,142,000 | |
| Cornell Rouge | 3 | 2.5 | 3 | 2000-2500 | Unfinished | 1 | 14 | 1,230,000 | |
| Cornell Rouge | 4 | 3.5 | 3 | 200-2500 | Separate Entrance | 1.5 | 35 | 1,270,000 |
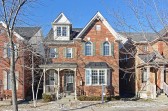
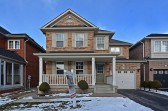
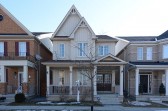
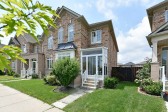
SEMI-DETACHED
| AREA | Bed | Bath | Storeys | Sq Feet | Basement | Garage | Days on Market | Sold Price | Notes |
| Cornell Village | 3+1 | 2.5 | 2 | 1500-2000 | Finished | 2 | 15 | 1,350,000 | |
| Cornell Village | 3 | 2.5 | 2 | 1942 | Unfinished | 2 | 29 | 1,242,000 | |
| Cornell Village | 4+2 | 3.5 | 2 | 1500-2000 | Finished | 1 | 11 | 1,258,000 | |
| Cornell Village | 3 | 2.5 | 2 | 1500-2000 | Unfinished | 2 | 2 | 1,180,000 | |
| Cornell Rouge | 3+1 | 2.5 | 3 | 2000-2500 | Finished | 1 | 8 | 1,240,000 |
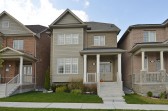
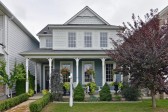
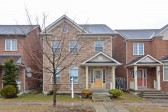
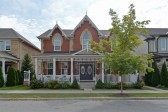
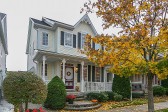
DETACHED
| AREA | Bed | Bath | Storeys | Sq Feet | Basement | Garage | Days on Market | Sold Price | Notes |
| Cornell Village | 4+1 | 3.5 | 3 | N/A | Finished | 2 | 21 | 1,585,000 | |
| Cornell Rouge | 4 | 3.5 | 2 | 2000-2500 | Unfinished | 2 | 10 | 1,578,000 | |
| Cornell Rouge | 4+1 | 3.5 | 2 | 2860 | Finished | 2 | 3 | 1,752,000 |