Here you will find the Cornell Sold Statistics for October 2020. As always, no % or averages. Just pure numbers without the marketing gimmick or spin. Out of respect for our neighbours, no specific addresses were used.
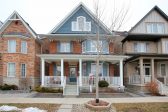
TOWNHOMES
| AREA | Bed # | Bath # | Storeys | Sq Feet | Basement | Garage # | Days on Market | Sold Price | Notes |
| Upper Cornell | 3 | 2.5 | 3 | N/A | Unfinished | 1 | 3 | 805,000 | |
| Upper Cornell | 3 | 1.5 | 2 | N/A | Unfinished | 2 | 4 | 805,000 | Faces 9th Line |
| Cornell Village | 3 | 2.5 | 3 | N/A | None | 1 | 1 | 825,888 | |
| Cornell Village | 3+1 | 2.5 | 2 | N/A | Finished | 1 | 4 | 900,000 | |
| Cornell Village | 3+1 | 3 | 3 | 2398 | None | 2 | 2 | 988,000 | Store Front, Live/Work |
SEMI-DETACHED
| AREA | Bed # | Bath # | Storeys | Sq Feet | Basement | Garage # | Days on Market | Sold Price | Notes |
| Cornell Village | 3+1 | 2.5 | 2 | 1500-2000 | Partial | 2 | 45 | 900,000 | |
| Cornell Rouge | 5 | 3.5 | 3 | 2000-2500 | Unfinished | 1 | 8 | 980,000 |
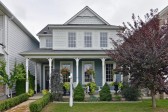
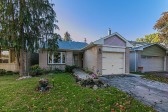
DETACHED
| AREA | Bed # | Bath # | Storeys | Sq Feet | Basement | Garage # | Days on Market | Sold Price | Notes |
| Cornell Village | 4+1 | 3.5 | 3 | 2500-3000 | Unfinished | 2 | 3 | 1,295,000 | Bateman Model |
| Cornell Rouge | 3+1 | 3.5 | 2 | 2000-2500 | Finished | 1 | 3 | 1,003,000 | Walnut Model |
| Cornell Rouge | 4+2 | 3.5 | 2 | 2500-3000 | Unfinished | 2 | 26 | 1,269,000 | New Build |
| Cornell Rouge | 4 | 2.5 | 2 | 2500-3000 | Unfinished | 2 | 6 | 1,350,000 | |
| Cornell Rouge | 4 | 3.5 | 2 | 3000-3500 | Unfinished | 2 | 9 | 1,430,000 | |
| Grand Cornell | 3 | 3.5 | 2 | N/A | Finished | 2 | 1 | 1,050,600 |